 The core of this interactive project is an interactive map and gallery representing oral history interviews centered around Portobelo, Panama’s Congo Tradition.
Each of the 93 cards in the gallery or dots on the map represent a segment of a single interview. These map dots do not represent literal location points; rather, they are intended as a figurative spatial representation of the contents of these interviews.
Exploring the Interactive Project
 There are three main ways to navigate this interactive digital project: 1) through the concept map, 2) through the gallery view, and 3) through the interview archive. For details about the interactive gallery and map see the sections below.
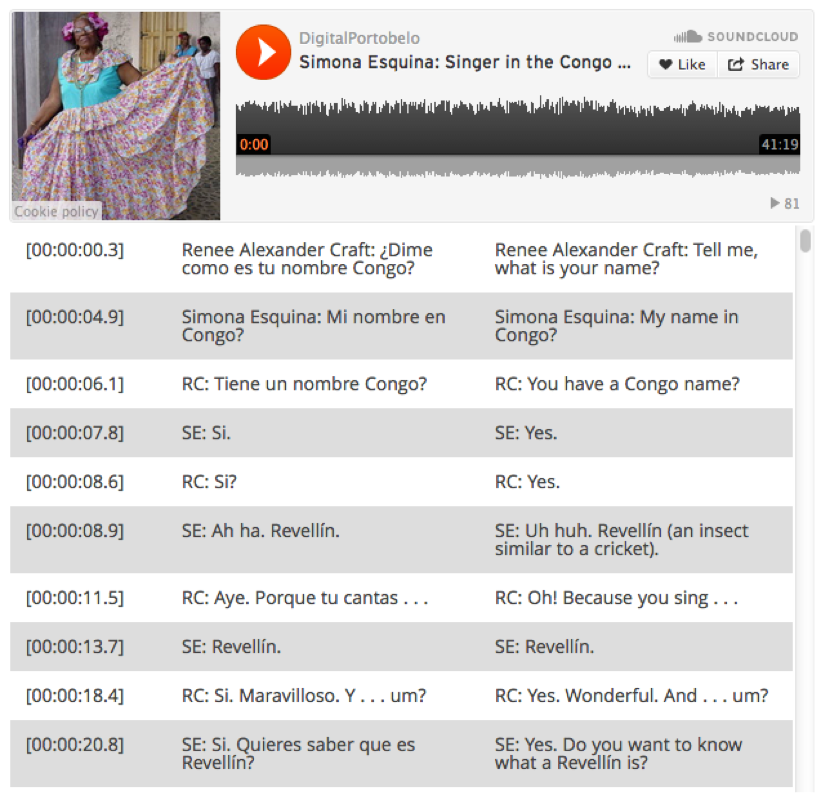
The interview archive links to the full audio files for each interview. Each page that contains a complete interview will have an embedded media player and corresponding transcript. You can play or pause the audio file as you wish by clicking the embedded red play button (once you begin playing, the button will change to a pause button). The transcript will scroll along in sync with the audio. You can jump forward or backward in the full interview by clicking on any timestamp at the far left of the transcript.
Under each scrollable transcript is a list of related excerpts. Clicking on any of the titles will provide more details about a given excerpt.
Launch the Concept Map | Launch the Gallery View
Map How-To’s
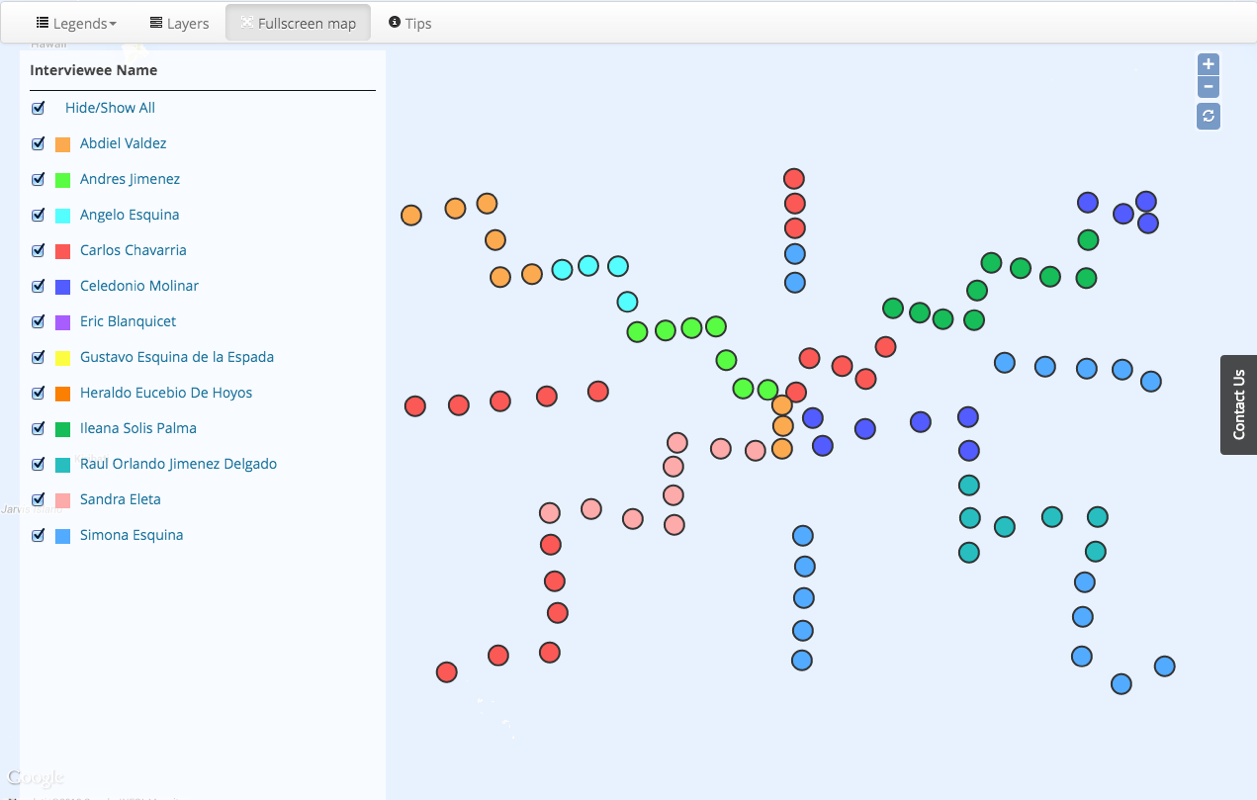
Map Interaction: Our interactive map is based on Google Maps technology. It enables the same sort of panning and zooming that is possible in Google. To zoom: double click or use the plus/minus buttons on the top right. To move around the map (panning): click and drag your mouse. To re-set the positioning of the map and the zoom level: hit the reset button (circular arrows) at the top right of the map (under the plus/minus buttons).
Map Dot Colors: Each dot on the map represents an excerpt of an interview. The dots appear in different colors based on the active map legend, which is a filter for visualizing the dots. There are several unique legends to explore, including one for Congo Characters, one about Congo Spaces, and one about various Congo Traditions. Changing the active legend (drop-down menu at the top left of the map screen) will change the appearance of the dots.
In most cases, many of the map dots contain multiple values in any given legend. The first value listed determines the default appearance of the map dot. As you click through individual terms in the legend, map dot colors may change to reveal secondary and tertiary associated terms. Clicking the “Hide/Show All” button at the top of each legend restores all of the map dots to the page.
Map Legends: Clicking on a value in a map legend (either checking the box or clicking on the term itself) will hide all markers not associated with that value. To see markers associated with multiple values, check all of the appropriate boxes. To restore all markers, select “Hide/Show All” (the first value in the legend).
Gallery How-To’s
Gallery Interaction: The gallery view is made of topic cards, each corresponding to a marker on the concept map and representing an excerpt of an interview. The cards appear in different colors based on the map legend that identifies by Interviewee Name. You can either sort or filter to identify information contained in each topic card.
Gallery Sort: Clicking on Sort by will give a drop-down menu of unique values that each topic card identifies with including Congo Spaces, Congo Traditions, and Time Period. Sorting topic cards by value will move each topic card to a new location in the visualization. For example, sorting by Time Period will make the topic cards line up chronologically by the time period discussed in each interview excerpt.
Gallery Filter: Clicking on Filter by will also give a drop-down menu of unique values that each topic card identifies with. Click first on a value, then click on “Options” next to the “Filter by” button. This will bring up a pop-up window that allows for specifications of which topic cards to view. Check which values to view, click Apply, and the topic cards will filter out. For example, filtering by Ethnoracial Identity Discussed allows for several options: Afrodescendiente, Afro-Colonial, French Antillean, La Raza Negra, Spanish, or N/A. The topic cards can then be filtered by one or many of these options. To return to a view of all topic cards, click No Filter.
How To’s For Map and Gallery
Excerpt Details: Clicking on a map dot or gallery card brings up a lightbox (or info bubble) containing an excerpt of the audio and its corresponding Spanish and English transcripts. You can hit the red play button to begin listening. The timestamp at the left of the transcript will be highlighted, and the transcript will roll along in sync with the audio. Clicking on the green “Read more about this excerpt” button opens to a page with additional information about that chunk of interview. Each excerpt contains a link to the complete interview.
Accessing the Full Interview from the Map or Gallery: Clicking on the green “Listen to the entire interview” button in the pop-up window will open up a new browser tab, where the entire interview and its corresponding transcripts can be accessed. As with the excerpt, you can play or pause the audio file as you wish. The transcript will scroll along in sync with the audio. You can jump forward or backward in the full interview by clicking on any timestamp.
Leaving the Map or Gallery: To exit the interactive project and return to the rest of the site, click the “Home” button above the map. This will close the visualization and return you to the home page.
Please note that the interactive project may not load properly in Internet Explorer; users are encouraged to view the map in either the Firefox or Chrome Browser.
Launch the Gallery | Launch the Map